Industry Trends & Research
03.23.2026
Inside Karat’s 2026 Global Engineering Talent Rankings

Gordie Hanrahan
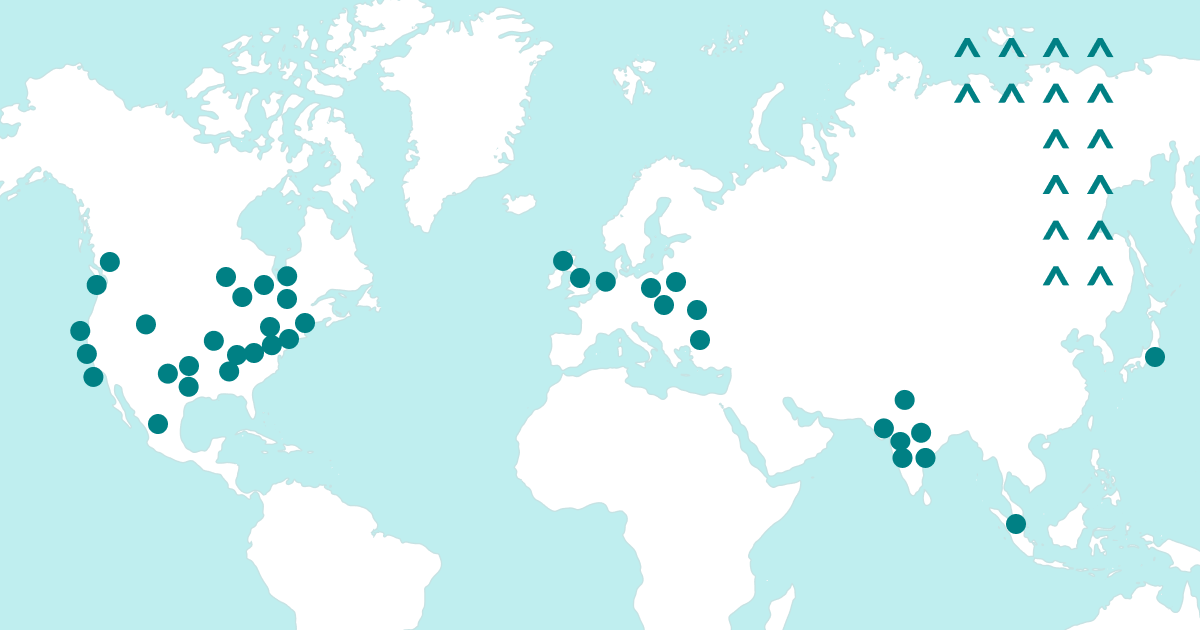

Artificial intelligence is reshaping not only how software is built, but how engineering excellence compounds into competitive advantage.
Karat’s latest research shows that AI disproportionately amplifies the productivity and impact of top-performing engineers. Elite talent uses AI to accelerate development cycles, solve more complex technical challenges, and drive innovation at scale. As a result, performance gaps between top engineers and the broader workforce are widening — making access to elite talent a strategic priority for technology leaders.
Karat’s 2026 Top Cities for Engineering Talent report (which will be released on Thursday, 3/26) identifies where that elite talent is most concentrated across the global labor market.
This year’s edition also introduces an important evolution in how we analyze talent distribution. As Karat’s client base has expanded into AI-enabled interviews, financial services, enterprise modernization, and global consulting organizations, we now have visibility into a broader cross-section of the engineering workforce than ever before.
To ensure our rankings reflect true local labor market composition, we introduced a market-weighted methodology that normalizes performance data based on each city’s employer mix. This enhancement strengthens the durability of our rankings while preserving the same rigorous performance benchmarks used in prior years.
The result is the clearest picture yet of where elite engineers live and work — and how global talent ecosystems are evolving in the age of AI.
2026 Top Cities report methodology
Scoring
Karat’s top city rankings are based on the concentration of elite software engineers residing in major metro areas. We define “elite” engineers as people who score in the top quartile of Karat’s technical interviews.
We chose this threshold because it represents a level of technical performance that allows candidates to advance beyond the technical interview at nearly all organizations. It also serves as an aspirational talent bar for organizations seeking to improve engineering quality, which is a top priority for engineering leaders as AI continues to amplify the impact of the highest-performing engineers.
The data compares the 3-year rolling average of candidate performance across each market and is based on Karat’s dataset of over 600,000 interviews. A rolling three-year window smooths short-term hiring volatility while still capturing structural shifts in talent distribution. Data is current as of March, 2026.
Cities with fewer than 50 interview results were excluded from this year’s report. This threshold balances statistical stability with broad geographic coverage.
For more information about Karat’s interviewing methodology and rubrics, visit: https://karat.com/resource/human-ai-technical-interview-rubrics/
But wait…how can there be more than 25% of candidates scoring in the top quartile?
Good question. There are, in fact, only 25% of candidates in our top quartile (because that’s what a quartile is). But talent is not distributed evenly around the world. Some cities–especially major tech hubs–have higher concentrations of elite talent than you would expect from a random distribution. We’ve seen those distributions shift over the years as organizations expand geographically (for example, Washington D.C. saw a big influx of talent after Amazon’s HQ2 opening), and as trends like remote work and return-to-office mandates influence where software engineers seek work. This report examines those evolving talent patterns.
Weighting (methodology update)
Karat’s Top Cities rankings have historically used the concentration of top-quartile engineers based on unweighted interview performance.
This method was relevant and accurately reflected the market we served when our ICP was primarily tech companies, because our geographic comparisons consistently represented engineers working in tech.
In recent years, Karat’s client portfolio has diversified significantly across industries and geographies. This is especially true with enterprises across the financial services, banking, insurance, retail, energy, and consulting sectors. This expansion gives Karat visibility into a much broader cross-section of the global technical workforce.
To address this, we are introducing a weighting methodology that normalizes interview performance based on each market’s estimated employer mix. This approach produces rankings that better reflect the actual distribution of engineering talent across geographies.
While Karat’s prior rankings accurately reflected engineering talent within technology-sector hiring markets, this updated methodology expands that lens to reflect the full technical labor market.
The result is a more stable, durable, and market-representative ranking system that:
- Reflects the full technical labor market, not just Karat clients
- Reduces bias from over- or under-represented industries in Karat’s dataset
- Maintains comparability year over year as client mix and hiring geographies evolve
- Produces a more realistic estimate of where elite engineering talent is concentrated globally
Importantly, the updated methodology preserves longitudinal integrity by maintaining the same performance benchmarks and evaluation rubrics used in prior reports.
How we estimate the engineering workforce size and composition by city
To ensure Karat performance data reflects market conditions, we estimate how engineers in each metro are distributed across employer types:
- Tech companies (product-led firms)
- Digital transformation enterprises (non-tech firms modernizing technology; i.e. finserv, insurance, energy, etc.)
- IT services providers (consultancies and outsourcing firms)
Data Sources Used to Estimate City Workforce Mix, Cost, and Size
Median salary data comes from levels.fyi, which provides the most comprehensive standardized global dataset of software engineering compensation.
Because no global dataset directly segments engineers by employer type, we aggregated data across multiple reliable proxies.
To estimate the size of technical workforces and the industries that employ them, we limited our research to three credible data types. These datasets indicate industry concentration, enabling estimates of engineers working inside enterprise sectors vs technology firms.
- U.S. Bureau of Labor Statistics Occupational Employment & Wage Statistics
- OECD digital economy workforce data
- National labor statistics agencies (UK ONS, Statistics Canada, Eurostat, etc.)
To understand regional employer concentration and tech-sector density, we researched tech ecosystem and talent studies, including:
- CBRE Scoring Tech Talent reports
- CompTIA Cyberstates workforce reports
- Brookings Institution metro digital economy studies
This research enables us to estimate the percentage of engineers working inside enterprise sectors vs technology firms. Using that data, we classified markets into the following archetypes that indicate industry concentration.
Tech-sector dominated (ex, Bay Area, Seattle, Austin)
- Tech companies: 60%-80%
- DT enterprise: 15%-30%
- ITSPs: 5%-10%
Emerging/diversified tech ecosystems (ex, Denver, Raleigh, Vancouver, Amsterdam)
- Tech companies: 40%-55%
- DT enterprise: 30%-40%
- ITSPs: 5%-15%
Enterprise tech centers (ex, New York, Chicago, Dallas, Tokyo, London)
- Tech companies: 25%-40%
- DT enterprise: 45%-60%
- ITSPs: 5%-12%
Outsourcing hubs (ex, Bangalore, Hyderabad, Warsaw, Buenos Aires)
- Tech companies: 20%-30%
- DT enterprise: 25%-40%
- ITSPs: 30%-50%
After assigning an archetype, we adjusted weights based on:
- Major employer footprint
- Industry specialization
- Government tech presence
- Startup funding density
- Known IT services delivery clusters
This ensures the model reflects local labor realities rather than rigid classifications. Most importantly, this creates a realistic estimate of elite talent concentration that ensures the rankings remain accurate regardless of changes to Karat’s client mix over time.
Full list of weightings by city
| City | % of roles at tech companies | % of roles at DT enterprises | % of roles at ITSPs |
| Seattle | 63% | 29% | 8% |
| Amsterdam | 45% | 47% | 8% |
| SF/Bay Area | 75% | 20% | 5% |
| Tokyo | 45% | 45% | 10% |
| Toronto | 48% | 42% | 10% |
| Washington DC | 35% | 45% | 20% |
| Pittsburgh | 40% | 53% | 7% |
| Austin | 65% | 25% | 10% |
| Bangalore | 35% | 25% | 40% |
| Singapore | 50% | 45% | 5% |
| New York City | 48% | 44% | 8% |
| Chicago | 30% | 58% | 12% |
| Dallas | 35% | 53% | 12% |
| Vancouver | 50% | 42% | 8% |
| Delhi NCR | 30% | 40% | 30% |
| London | 40% | 50% | 10% |
| Raleigh | 45% | 47% | 8% |
| San Diego | 50% | 43% | 7% |
| Mumbai | 35% | 45% | 20% |
| Sydney | 40% | 50% | 10% |
| Twin Cities | 35% | 57% | 8% |
| Atlanta | 35% | 53% | 12% |
| Los Angeles | 40% | 52% | 8% |
| Boston | 50% | 43% | 7% |
| Denver | 45% | 47% | 8% |
| Nashville | 35% | 57% | 8% |
| Hyderabad | 30% | 62% | 8% |
| Houston | 28% | 62% | 10% |
| Detroit | 35% | 57% | 8% |
| Warsaw | 30% | 35% | 35% |
| Philadelphia | 30% | 60% | 10% |
| Charlotte | 30% | 62% | 8% |
| Dublin | 65% | 27% | 8% |
| Pune | 25% | 35% | 40% |
| Krakow | 30% | 30% | 40% |
| Istanbul | 35% | 45% | 20% |
| Wroclaw | 25% | 35% | 40% |
| Mexico City | 35% | 45% | 20% |
| Chennai | 25% | 35% | 40% |
| Bucharest | 30% | 35% | 35% |
Get the full report
Karat’s 2026 Top Cities for Engineering Talent report provides data-driven insights to help technology and business leaders make smarter workforce decisions, from hiring strategy to location planning and long-term talent investment. Explore the full rankings, deeper market analysis, and detailed methodology on our interactive landing page, and download the complete report to see where the world’s top engineering talent is rising and why it matters for your organization’s future.
Related Content

AI Hiring
09.16.2026
To assess engineering skills in financial services, organizations should define the competencies needed for each role, develop interview content that measures both foundational engineering and AI skills, evaluate candidates in realistic environments, and standardize their interviews and scoring. By taking these steps, you’ll be able to reliably identify software engineers who can build secure products […]

AI Hiring
08.24.2026
In every issue of The Talent Signal newsletter, Karat Co-Founder and President Jeffrey Spector explores the trends reshaping technical hiring. From changing skill requirements to new hiring challenges, the series helps engineering leaders understand how the broader landscape is changing software engineering and what it means for building high-performing teams. One of the biggest themes […]

AI Hiring
07.01.2026
Financial services engineering leaders are tasked with modernizing legacy systems, shipping new digital products, and navigating an AI revolution – all while competing with big tech and fast-growing startups for increasingly scarce engineering talent. To better understand where FinServ engineering leaders are feeling the most pressure, Karat analyzed data from 303 CTOs, CIOs, VPs of […]